Back to School 2026:
which brands win on
Instagram and TikTok
A June 2026 data study comparing the same before-the-bell window year over year: 252,596 back-to-school posts across Instagram, TikTok and YouTube in the 2026 ramp (May 1 to Jun 18), against 223,145 in the same window of 2025. Who won in 2025, and who is climbing into 2026.
Five findings the back-to-school data makes undeniable
Comparing the same before-the-bell window year over year, what 252,596 back-to-school posts in 2026 (vs 223,145 in 2025) reveal about where creator attention, and brand money, should go.
- SHEIN still owns back to school. In the 2026 ramp it drew 114 creator mentions, about 34% of tracked brand mentions, up from 85 a year earlier and still number one.
- Back to school is a fashion and dorm story. Fashion and apparel is 46% of 2026 brand mentions; dorm, sleep and home is the fastest riser, roughly doubling year over year. Supplies brands are a small minority.
- Instagram for volume, TikTok for growth. Instagram carries 65.7% of 2026-ramp posts, but TikTok grew fastest at +31% year over year and earns the most engagement per post (2,576).
- Parents and students carry the content. Family, motherhood and college-lifestyle creators drive the most back-to-school engagement, not traditional shopping hauls. Briefs should target that creator profile.
- The dorm-and-sleep pack is climbing. Year over year into 2026, Sleepyhead (+600%), Emma (+383%) and YesStyle (+357%) are the fastest risers, while SHEIN holds number one. Monster High, Nomad Watch Works and Discount School Supply arrive as new entrants.
- The window is already open. Back-to-school posts rose from 223,145 to 252,596 in the same May-to-mid-June window year over year. Brands that brief creators early capture the ramp before the July to August peak.
The brands creators tag most heading into 2026
Canonical brands ranked by back-to-school creator mentions in the 2026 ramp (May 1 to Jun 18), with the same window a year earlier for comparison. SHEIN leads, with a dorm-and-sleep pack close behind.
View underlying data, brand mentions 2026 vs 2025
| # | Brand | 2026 | 2025 | Δ |
|---|---|---|---|---|
| 1 |  SHSHEIN SHSHEIN | 114 | 85 | +34% |
| 2 |  EMEmma EMEmma | 58 | 12 | +383% |
| 3 |  YEYesStyle YEYesStyle | 32 | 7 | +357% |
| 4 |  SLSleepyhead SLSleepyhead | 21 | 3 | +600% |
| 5 |  NWNomad Watch Works NWNomad Watch Works | 17 | 0 | new |
| 6 |  LULuvlette LULuvlette | 16 | 0 | new |
| 7 |  BEBelevels BEBelevels | 13 | 4 | +225% |
| 8 |  MHMonster High MHMonster High | 10 | 0 | new |
| 9 |  CGCallie Gifts CGCallie Gifts | 9 | 4 | +125% |
| 10 |  GSGUD Slip Tape GSGUD Slip Tape | 7 | 7 | +0% |
| 11 |  SLSleep&Glow SLSleep&Glow | 6 | 8 | -25% |
| 12 |  DSDiscount School Supply DSDiscount School Supply | 6 | 0 | new |
Source · Upfluence proprietary data · back-to-school posts, May 1 to Jun 18, 2026 (2025 for comparison)
SHEIN takes about 34% of every tracked back-to-school brand mention in the 2026 ramp. For competitors, the contest is not for first place; it is for the visible space directly behind SHEIN, where Emma, YesStyle and the dorm-and-sleep pack are still separable.
Who won in 2025, and who is climbing into 2026
Same May-to-mid-June window both years, so it is a like-for-like before-the-bell comparison. SHEIN led in 2025 and still leads, but a dorm-and-sleep pack is climbing fast behind it.
Source · Upfluence proprietary data · back-to-school posts, May 1 to Jun 18, 2025 vs 2026
Biggest climbers, 2025 → 2026
| Brand | 2025 | 2026 | Δ rank | Δ vol |
|---|---|---|---|---|
| SLSleepyhead | #16 | #4 | +12 | +600% |
| EMEmma | #3 | #2 | +1 | +383% |
| YEYesStyle | #5 | #3 | +2 | +357% |
| BEBelevels | #11 | #7 | +4 | +225% |
| CGCallie Gifts | #12 | #9 | +3 | +125% |
| SHSHEIN | #1 | #1 | 0 | +34% |
 TETemu TETemu | #15 | #18 | -3 | +33% |
 PRProzis PRProzis | #13 | #14 | -1 | +25% |
| GSGUD Slip Tape | #6 | #10 | -4 | 0% |
| SLSleep&Glow | #4 | #12 | -8 | -25% |
 MAMaxcolchon MAMaxcolchon | #7 | #19 | -12 | -43% |
 PHPhotowall PHPhotowall | #9 | #25 | -16 | -60% |
New in 2026
| Brand | 2026 mentions |
|---|---|
| NWNomad Watch Works | 17 |
| LULuvlette | 16 |
| MHMonster High | 10 |
| DSDiscount School Supply | 6 |
 AEAelfric Eden AEAelfric Eden | 5 |
| LLLive Love Posh | 5 |
SHEIN was the 2025 back-to-school leader and grew again into 2026 (+34%), so the throne is unchanged. The movement is behind it: Sleepyhead (+600%), Emma (+383%) and YesStyle (+357%) are the fastest climbers, and Monster High, Nomad Watch Works and Discount School Supply arrive as new entrants. The pattern is a dorm-and-sleep land grab, with fast fashion and value retail still owning the top of the board.
| Brand | 2025 mentions | 2026 mentions | Change |
|---|---|---|---|
| SHEIN | 85 | 114 | 34% |
| Emma | 12 | 58 | 383% |
| Sleep&Glow | 8 | 6 | -25% |
| YesStyle | 7 | 32 | 357% |
| GUD Slip Tape | 7 | 7 | 0% |
| Maxcolchon | 7 | 4 | -43% |
| Photowall | 5 | 2 | -60% |
| Belevels | 4 | 13 | 225% |
| Callie Gifts | 4 | 9 | 125% |
| Prozis | 4 | 5 | 25% |
| Temu | 3 | 4 | 33% |
| Sleepyhead | 3 | 21 | 600% |
The creators driving back-to-school engagement
Highest-engagement creators posting back-to-school content, by platform. Vetted against bios to keep genuine family, parenting and student-lifestyle accounts and drop off-theme classifier matches.
 WE
WE GU
GU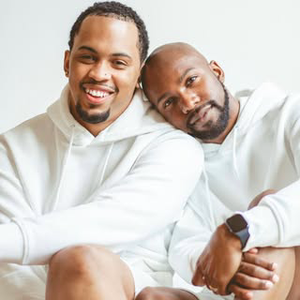 TA
TA JJ
JJ ON
ON FE
FE PO
POTikTok
 MO
MO KR
KR QU
QU LI
LI BR
BR ON
ON AJ
AJSource · Upfluence proprietary data · back-to-school content, 2025 and 2026
Instagram, by ER%
TikTok, by ER%
View underlying data, creators with engagement and ER%
| Instagram creator | Followers | BTS posts | Engagement | ER% |
|---|---|---|---|---|
| @westonvansoest | 884,333 | 35 | 9,553,262 | 30.9% |
| @gunnsgirls | 1,452,716 | 14 | 1,432,640 | 7.0% |
| @terrell.and.jarius | 588,512 | 8 | 1,805,068 | 38.3% |
| @juicy.jacobb | 901,883 | 5 | 1,778,627 | 39.4% |
| @onlyonealiya | 661,791 | 17 | 1,328,273 | 11.8% |
| @for_eversteph | 51,547 | 4 | 1,310,163 | reach-driven |
| @posterboyzzzz | 149,292 | 5 | 2,537,643 | reach-driven |
| TikTok creator | Followers | BTS posts | Engagement | ER% |
|---|---|---|---|---|
| @mommajules_ | 349,400 | 15 | 8,412,751 | reach-driven |
| @pb.sdsu | 196,500 | 10 | 7,235,849 | reach-driven |
| @krissleos | 7,600,000 | 12 | 4,991,350 | 5.5% |
| @queencitytrends | 4,700,000 | 11 | 3,482,033 | 6.7% |
| @lifewithcina | 1,100,000 | 20 | 2,434,735 | 11.1% |
| @brookexaloura | 2,500,000 | 9 | 2,530,249 | 11.2% |
| @only1aliya | 2,400,000 | 13 | 2,531,744 | 8.1% |
| @ajcollinss | 1,100,000 | 16 | 2,668,718 | 15.2% |
Source · Upfluence proprietary data · back-to-school content, 2025 and 2026
The creators winning back to school are parents and students documenting real routines, not haul-only shoppers. On TikTok the leaders are mom-and-lifestyle and college accounts; on Instagram, home-and-motherhood creators. Briefs that fit a first-week-of-school story will travel further than a discount-code drop.
Unlike brands, the back-to-school creator roster resets each year. Of the top 27 creators by back-to-school engagement in the 2026 ramp, about 56% (15 of 27) had no back-to-school content in the same window a year earlier. Brand partners are stable year to year; the creators carrying them are mostly new, so a 2026 program should re-scout talent rather than re-book last year’s names.
Which industries are growing, 2025 to 2026
Back-to-school brand mentions by industry, same May-to-mid-June window both years. Fashion leads, but dorm, sleep and home is the fastest riser, roughly doubling year over year.
View underlying data, industry mentions 2025 vs 2026
| Industry | 2025 | 2026 |
|---|---|---|
| Fashion & apparel | 92 | 167 |
| Dorm, sleep & home | 51 | 100 |
| Gifts & extras | 40 | 59 |
| School & office supplies | 10 | 24 |
| Food & meal kits | 6 | 8 |
| Marketplace & value retail | 3 | 4 |
| Beauty & personal care | 0 | 4 |
Source · Upfluence proprietary data · back-to-school posts, May 1 to Jun 18, 2025 vs 2026
Fashion and apparel is still the biggest slice of the back-to-school conversation at 46% of mentions, but dorm, sleep and home is where the growth is, roughly doubling year over year. Back to school is increasingly a move-in-and-outfit story, so apparel plus dorm brands is where the momentum sits heading into 2026.
Which platform wins back to school?
Back-to-school posts and engagement per post by platform, same May-to-mid-June window both years. Instagram wins on volume and reach; TikTok wins on engagement per post and is growing fastest.
| 2026 ramp | Posts | Share | Eng / post |
|---|---|---|---|
| 166,064 | 65.7% | 1,450 | |
| TikTok | 44,524 | 17.6% | 2,576 |
| YouTube | 42,008 | 16.6% | 854 |
Source · Upfluence proprietary data · back-to-school posts, May 1 to Jun 18, 2025 vs 2026
Instagram wins back to school on reach: it carries 65.7% of 2026-ramp posts and the most creators. TikTok wins on intensity, at 2,576 engagements per post versus 1,450 on Instagram and 854 on YouTube. Run Instagram for the taggable haul and searchable reach, and TikTok for the engagement spike. YouTube trails on both.
Back-to-school posts that tag a brand
Hand-picked high-engagement back-to-school TikToks, each drawn from the brand-mention base so every one tags a real brand. Live embeds; tap to watch.
Frequently asked questions
Direct answers to what journalists and brand teams ask about the back-to-school 2026 dataset.
Which brand gets the most creator mentions for back to school 2026?
SHEIN. In the 2026 ramp (May 1 to Jun 18) it drew 114 creator mentions, about 34% of tracked brand mentions, up from 85 in the same window of 2025 and still the clear number one.
How many back-to-school posts did this study analyse?
252,596 back-to-school posts across Instagram, TikTok and YouTube in the 2026 ramp (May 1 to Jun 18), compared with 223,145 in the same window of 2025. The study uses one like-for-like window both years.
Which industries dominate back-to-school creator content?
Fashion and apparel, at 46% of 2026 brand mentions, well ahead of every other industry. Dorm, sleep and home is the fastest-growing, roughly doubling year over year. Back to school is a fashion and dorm story.
Which platform should brands prioritise for back to school?
Instagram for volume (65.7% of 2026-ramp posts and the most creators). But TikTok earns far more interaction per post (2,576 versus 1,450 on Instagram) and grew fastest at +31% year over year, so a reach-plus-engagement plan uses both.
Which creators drive the most back-to-school engagement?
Family, parenting and student-lifestyle creators. On TikTok, mom-and-lifestyle accounts such as mommajules_ and college groups such as pb.sdsu lead; on Instagram, home-and-motherhood creators such as gunnsgirls and westonvansoest top the vetted list. Rankings are vetted against bios to remove off-theme matches.
Are these mentions the same as sales or reach?
No. A mention is a creator tagging or naming a brand in a back-to-school post. It signals share of creator attention, not units sold or guaranteed audience reach.
Why does SHEIN appear under several handles?
SHEIN runs many regional accounts (US, France, Mexico, UK, Canada and more) plus a kids handle. We rolled these into one SHEIN entity using Level 1 canonicalisation so the brand is not under-counted.
Is this US-only data?
No. The dataset is global English-language back-to-school content. Several leaders (SHEIN, Temu, AliExpress, YesStyle) are global value retailers, and some handles are regional.
How were back-to-school posts identified?
By matching post text against a back-to-school keyword pattern (back to school, school supplies, school haul, dorm, first day of school, college move-in and related phrases). It is a content theme, not a fixed creator category, and the bare term BTS was excluded to avoid the K-pop collision.
Who won back to school in 2025, and who is climbing into 2026?
SHEIN led in 2025 and still leads in 2026 (up about 34% year over year in the same May-to-mid-June window). The fastest climbers behind it are Sleepyhead (+600%), Emma (+383%) and YesStyle (+357%), and new entrants include Monster High, Nomad Watch Works and Discount School Supply. It is a dorm-and-sleep surge behind a fashion leader.
When is the best time to brief back-to-school creators?
Early. Deals are already live in June (for example student laptop offers), and creator calendars fill before the July to August peak, so briefs that land in June and early July capture the ramp.
How we built this
Source, extraction, filtering, categorisation and vetting, window and the honest gaps.
Data source
Upfluence creator data lake: public Instagram, TikTok and YouTube posts. 252,596 back-to-school posts in the 2026 window and 223,145 in the 2025 window, after de-duplication.
Brand-mention extraction
Brand mentions come from detected brand-tag edges on each in-scope post. We keep social-profile and website targets and drop unknown targets.
Back-to-school filter
Posts qualify by matching a back-to-school keyword pattern in their text (back to school, school supplies, school haul, dorm, first day of school and related). The bare term BTS is excluded to avoid the K-pop collision.
Categorisation and vetting
Brand handles are canonicalised (Level 1) and mapped to a product type. Creator rankings are vetted against bios: off-theme classifier matches (pet, automotive, religious, viral one-offs and non-target-market celebrity accounts) are removed before ranking.
Window and ranking
One like-for-like window is used both years: May 1 to Jun 18, 2025 vs the same dates in 2026. Brands rank by mention volume; creators are a vetted shortlist by engagement on in-scope posts.
Honest gaps
Mentions are share of creator attention, not reach or sales. Brand tagging skews to Instagram. A few single-campaign handles were held out of the leaders. Three brands (Emma, ROMWE, unbranded handles) had no verified account, so they show initials rather than a logo.
| Rank | Brand | 2026 mentions | 2025 mentions |
|---|---|---|---|
| 1 | SHEIN | 114 | 85 |
| 2 | Emma | 58 | 12 |
| 3 | YesStyle | 32 | 7 |
| 4 | Sleepyhead | 21 | 3 |
| 5 | Nomad Watch Works | 17 | 0 |
| 6 | Luvlette | 16 | 0 |
| 7 | Belevels | 13 | 4 |
| 8 | Monster High | 10 | 0 |
| 9 | Callie Gifts | 9 | 4 |
| 10 | GUD Slip Tape | 7 | 7 |
| 11 | Sleep&Glow | 6 | 8 |
| 12 | Discount School Supply | 6 | 0 |
| Product type | Avg engagement per mention | Mentions | Total engagement |
|---|---|---|---|
| Fashion & apparel | 1,524 | 2,622 | 3,996,679 |
| Dorm, sleep & home | 908 | 398 | 361,405 |
| Food & meal kits | 782 | 145 | 113,328 |
| Marketplace & value retail | 750 | 191 | 143,160 |
| School & office supplies | 573 | 154 | 88,209 |
| Education services | 492 | 17 | 8,370 |
| Gifts & extras | 311 | 266 | 82,677 |
| Beauty & personal care | 174 | 28 | 4,859 |
| Platform | Posts | Creators | Engagement per post |
|---|---|---|---|
| 796,144 | 364,882 | 1,409 | |
| TikTok | 259,598 | 96,894 | 3,539 |
| YouTube | 198,503 | 51,289 | 946 |