Industry Report - Alcoholic Beverages
We have designed a quarterly dashboard for you to better understand the state of influencer marketing in the alcoholic beverage industry. See how brands are using influencer marketing across Instagram, YouTube, TikTok & blogs. Get insights on average engagement rate, audience demographic statistics and top performing hashtags.
A representative sample of 1,000 alcohol influencers working with brands on Instagram, YouTube, TikTok and blogs were analyzed for this study based on data collected between July – October 2020. Our experts have analyzed sponsored influencer posts and identified collaborations with over 100 wine, beer and spirits brands giving insights into the performance of influencer marketing in the alcoholic beverages industry.
This report is powered by Upfluence.
The Alcoholic Beverages Industry
The alcoholic beverage industry continues to grow and is expected to be worth $1,684 billion by 2025. Whilst there’s been a slight dip in revenue share from out-of-home sales due to COVID-19, by 2025 43% of spending on alcholic drinks will come from out-of-home spending at bars and restaurants. Offline sales of alcohol continue to dominate the market although the share of online sales is predicted grow from 2.5% to 3.1% by 2024.

Number of alcohol influencers across platforms
Our platform break-down shows Instagram to be the most popular platform used by alcohol influencers. Individual influencers may be active on more than one platform.
Top 5 most common platform combinations.
Average number of followers
Although there are fewer alcohol influencers on TikTok, they have by far the greatest number of followers.
Average engagements across platforms
Influencers on TikTok have a significantly higher engagement rate than Instagram, YouTube & Facebook.
TikTok is the leading platform with the most engagements on average.
Instagram audience
Gender split
Age break-down
Top 5 countries
Instagram engagements
Average engagement rate by influencer type. Alcohol micro-influencers report the highest engagement rates.
Micro: > 15K followers
Regular: 15K – 50K followers
Rising: 50K – 100K followers
Mid-size: 100K – 1M followers
Mega: > 1M followers
Average engagement rate by Influencer age
Average engagement rate by Influencer gender
Number of posts by theme
Number of engagements by theme
YouTube views
Macro & Mega alcohol influencers generate the most views for their content on YouTube.
Micro: > 15K followers
Regular: 15K – 50K followers
Rising: 50K – 100K followers
Mid-size: 100K – 500K followers
Macro: 500K – 1M followers
Mega: > 1M followers
Average views by age range
Average views by gender
Number of posts by theme
Number of views by theme
TikTok likes
Influencers with over 100K followers generate the most likes on TikTok
Micro: > 15K followers
Regular: 15K – 50K followers
Rising: 50K – 100K followers
Mid-size: 100K – 500K followers
Macro: 500K – 1M followers
Mega: < 1M followers
Top hashtags across platforms
Top 30 Instagram hashtags
Top 26 YouTube hashtags
Top 24 TikTok hashtags
Top keyword break-down Instagram
Top keyword break-down Youtube
Some Top Performing Influencers for You
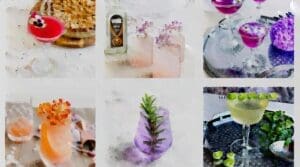
@the_margarita_mum
- 98% real followers
- 110K followers
- 43% audience in the US
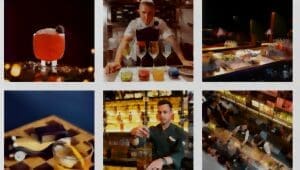
@bar_mixology_bartender
- 2.2K average likes
- 262K followers
- 89% post-effectiveness
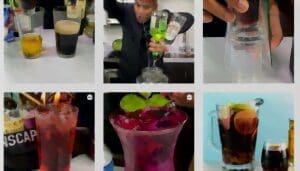
@tipsybartender
- 67K average likes
- 5.1M followers
- 72% audience female

@thegirlwithbeer
- 71% audience male
- 89K followers
- 99% post-effectiveness

@bad_birdy
- 4.3K average likes
- 187K followers
- 49% audience in the US

@wineteller
- 98% real followers
- 180K followers
- 103% post-effectiveness
More content for Food & Beverage brands
We publish content that will help you design influencer marketing strategies, run better campaigns and get inspiration from the best in the industry. Have a look at our recent posts or visit our blog for more!